July 23rd, 2026
We’ve had a busy couple of weeks at Punch. This week I want to share the key feature releases and bug fixes that have gone live in the past couple of weeks.
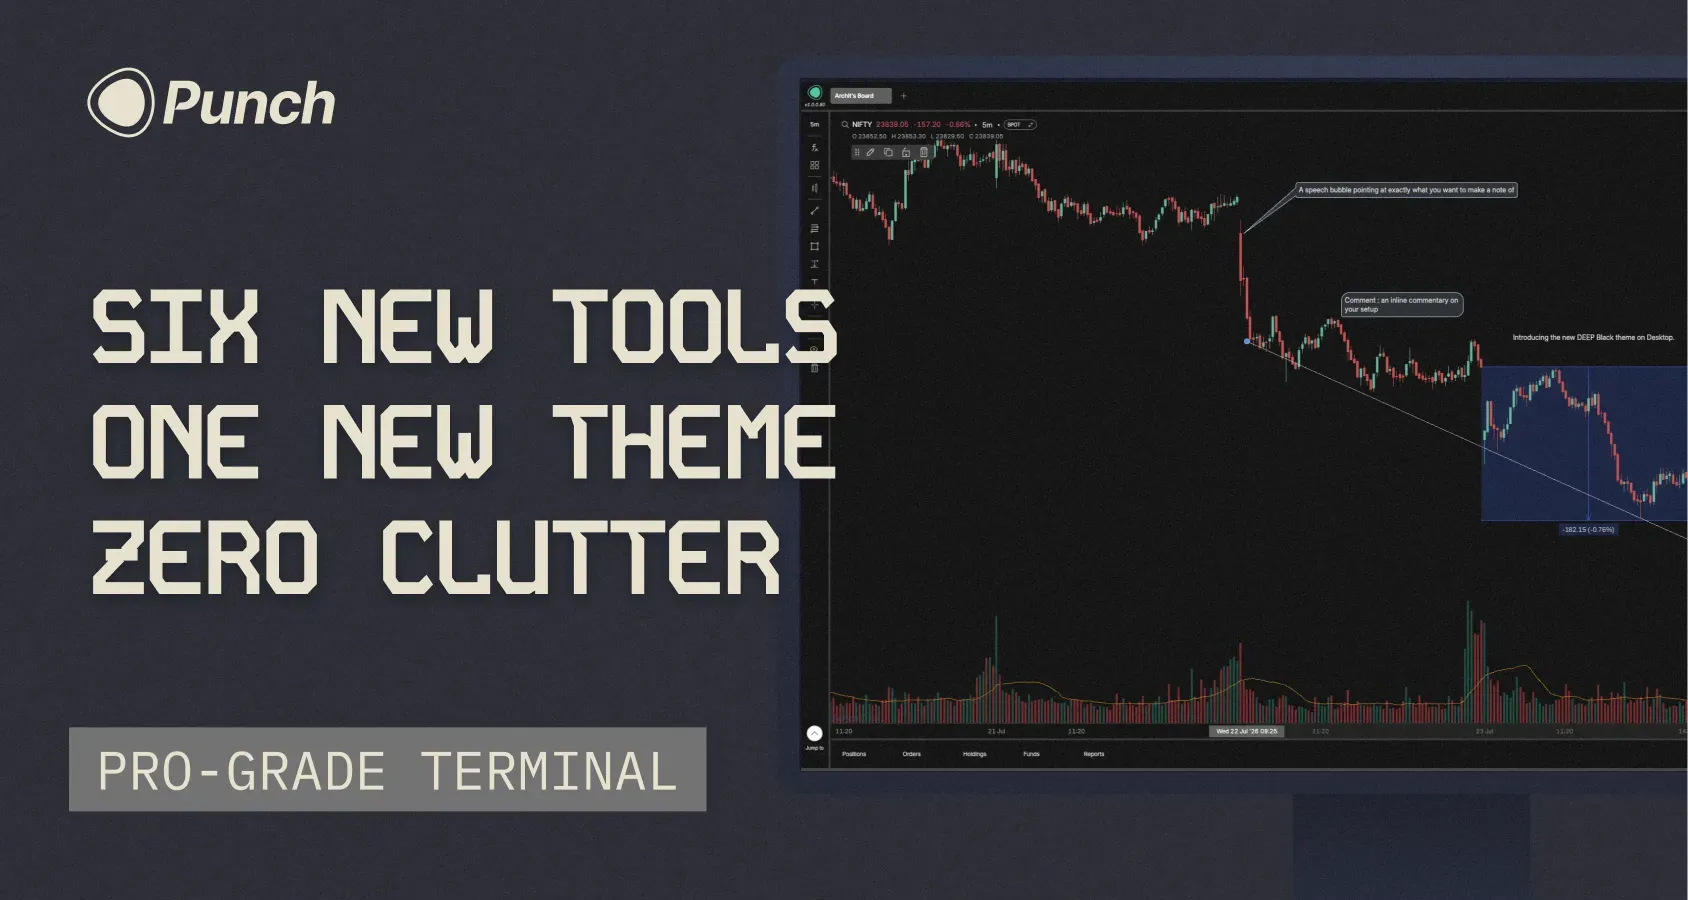
A big drop for chart builders; drawing tools get a serious upgrade on both platforms, mobile catches up to desktop, and there's a new theme for the pure-black background enthusiasts.
Android
Three desktop favorites are now on mobile:
Magnet mode — snap your drawings precisely to OHLC points
Text on drawings — annotate directly on your tools
Delete all — clear every drawing and indicator in one tap
Desktop
New Theme — Deep
You asked, we shipped. Deep joins Light and Dark: a true black background instead of the Punch-branded deep blue. Switch anytime from your theme settings.
Measure tools
Two new tools under Forecasting in the left panel — Price Range and Date Range. Measure moves and time spans without leaving the chart.
Three new annotation tools
Beyond text on drawings, you now get:
Text - drop a note anywhere on the chart
Callout - A speech bubble aimed at exactly what you want to call out
Comment - inline commentary on your setup
Hide, don't delete
Builders asked for this one loudly. Hide drawings and indicators instead of deleting them — bring them back whenever you need.
Coordinates tab
See the exact price and time for every drawing on your chart.
Fixes
Mobile
Fixed crashes when acting before a screen loaded — login/logout, Protect, Indicators/FX menu
Fixed a brief freeze while Positions loads your account data
Fixed a rare freeze on first launch after install
Fixed Stop-loss/Target missing after saving a Scalper preset (+ duplicate-order error on retry)
Smoother app — removed hangs from heavy database reads
Desktop
Fixed chart zoom
Refined the Scalper preset & shortcuts panel
Faster custom indicators
Fixed Key Levels on the chart
Fixed Scalper on/off, with a heads-up toast for unsupported instruments
I am sure you will feel these performance fixes and new features improve your quality of trading on Punch. Do keep posting on Builder’s lab.
See you again next week
- Archit
July 16th, 2026
Every scalper lives with the same tradeoff. Your desktop is where the day gets built — multi-chart analysis, drawings, indicators, option chain, option data, OI. But when it's time to punch, nothing matches the single-handed speed of mobile. That's why even on Punch, 90% of scalp trades happen on the phone.
So we stopped making you choose.
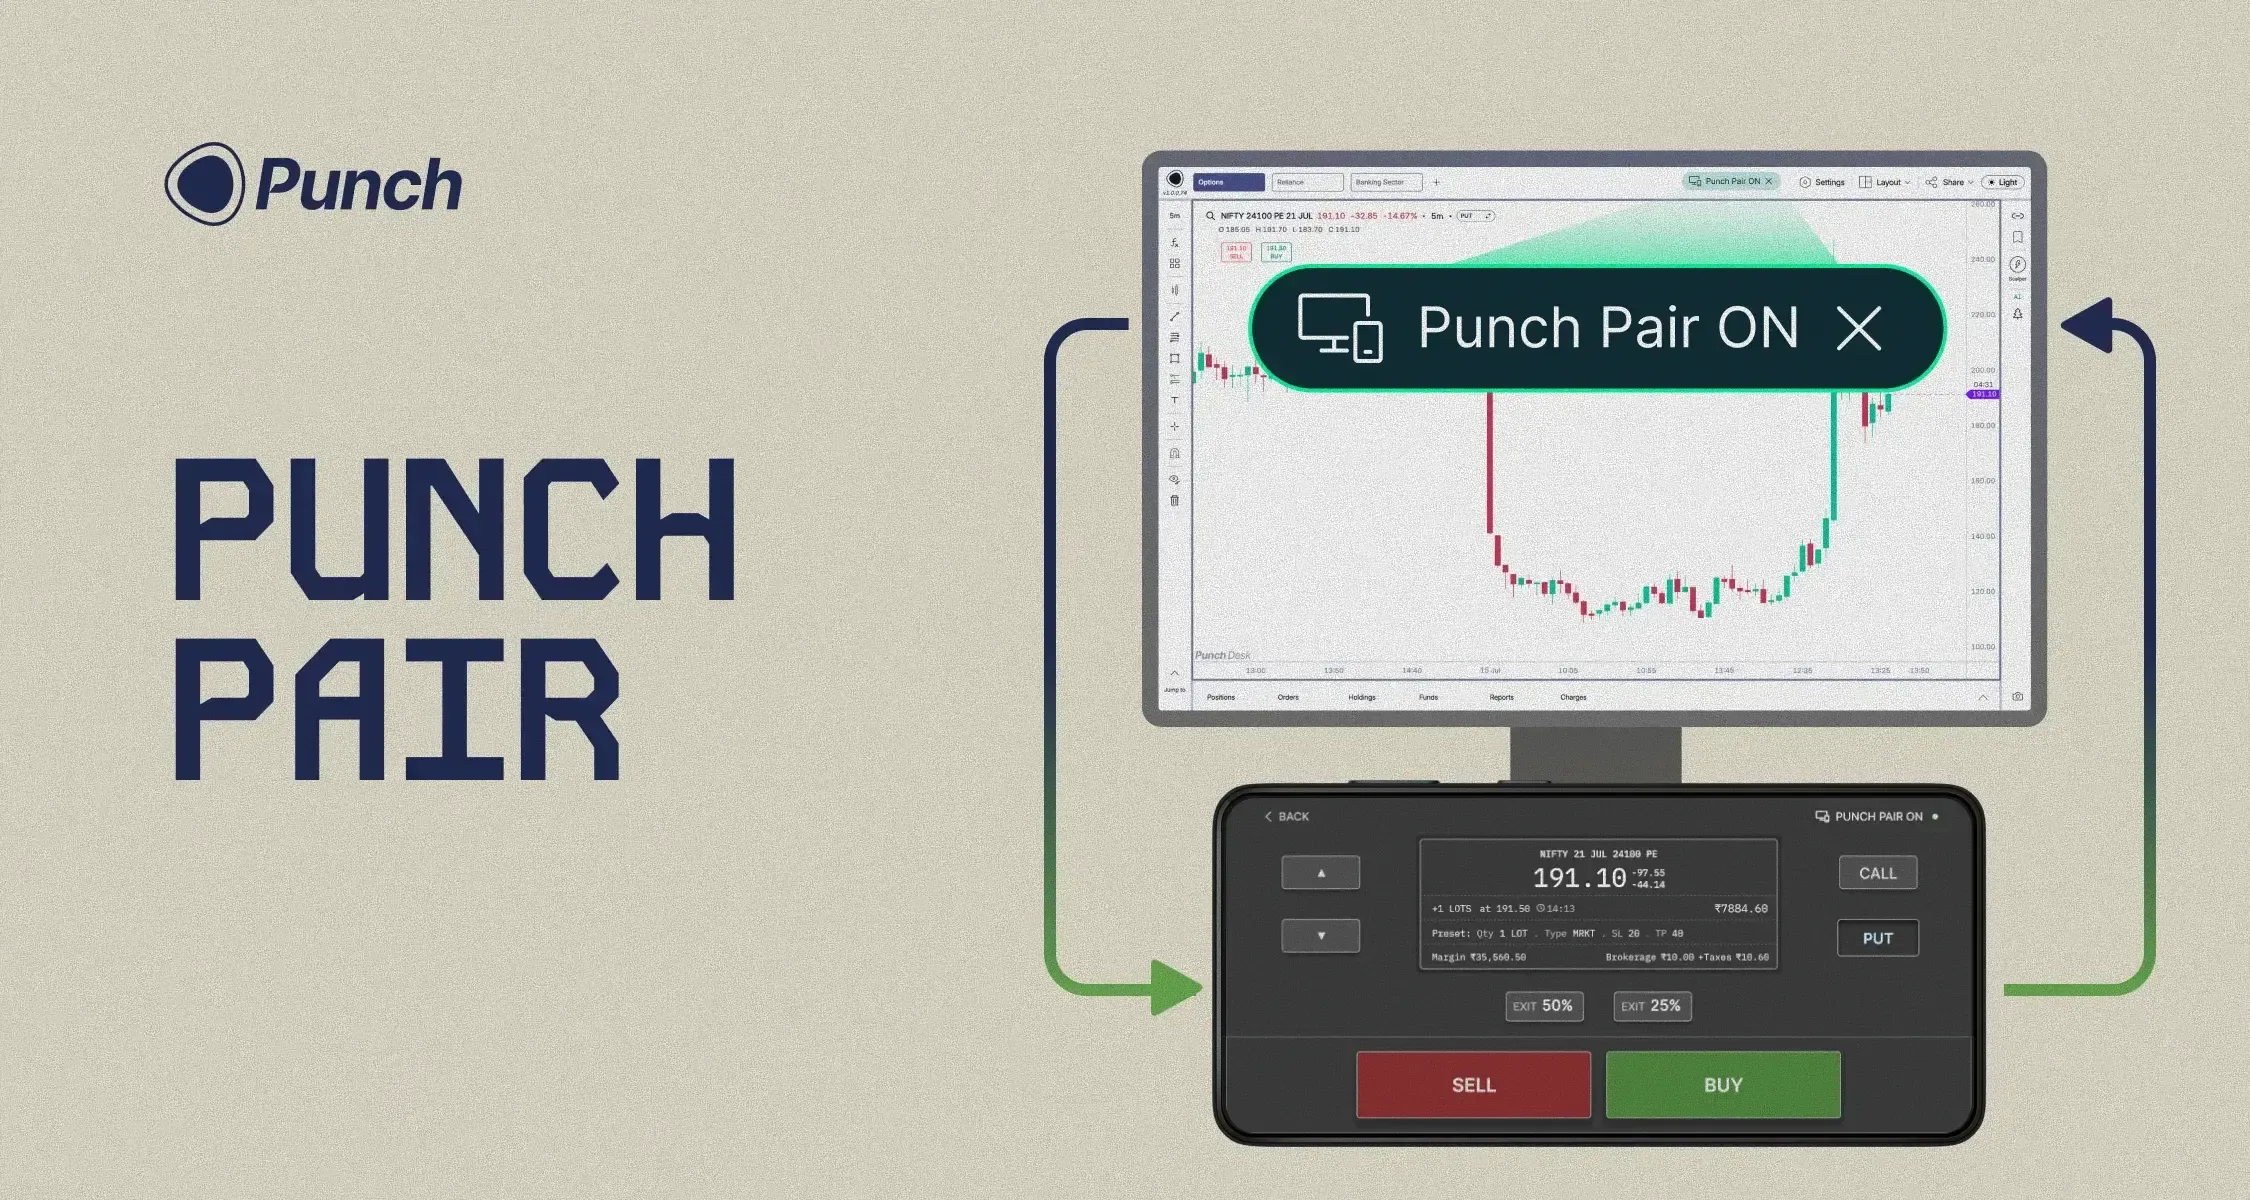
Punch Pair brings both worlds together. Pair your desktop to your mobile in seconds. Your desktop stays exactly as it is — every chart, every indicator, every data point right where you set it. Your Punch app transforms into a full-screen order form.
Select your strikes. Adjust lots. Punch to buy. Exit full or partial positions — all from your thumb. Eyes on the big screen, execution in your hand, placing hundreds of orders a day without ever breaking focus.
Want to scalp the first 20 minutes of the session? Pair up, punch away, and once you're done — unpair and step away.
Available on index charts. Since 95%+ of scalping happens on indices, that's where we've focused Punch Pair first.
Keep your eyes on the chart. Control your trading from your phone.
July 1st, 2026
A couple of weeks ago we told you where the ₹10 was going: four AI products, built in the open, shipping over the coming weeks. Today the first one lands.
You invested in it. Here's the first return.
Let's get to it.
Pine Script on Punch
Builder's Lab has always been full of indicator requests. The flow until now was the same every time. You'd post the indicator you wanted, wait for it to be prioritised, built, and shipped. This took weeks or even months.
We've cut that entire process out.
Open the Pine Script Editor from the right menu panel and paste in any script you have. Hit Plot on Chart, and Punch AI turns it into a custom indicator and plots it for you in minutes. If you want an indicator on Punch, you don't request it any more. You make it.
A few things worth knowing:
Give it a name and your custom indicator shows up in your Fx → Indicator panel, ready to use like any other indicator.
It stays fully editable. Open the script, tweak it, and plot again whenever you like.
For now it's on Punch Desk only. Mobile support and alerts on your Pine Script indicators are on the way.
This is the first of the four AI products we promised. Three more are coming over the next few weeks: Punch AI Copilot, the Research Desk, and the Trading Journal.
How to access: Open the Pine Script Editor from the right menu panel.
Shareable dashboards
This is truly one of the most unique and inventive features we have developed. You can now share your chart analysis with your friends.
Hit Share in the top bar and choose Share Layout. You get a link that anyone can open in their browser, it doesn’t matter if they have a Punch account or now, to view your setup and copy it straight into their own dashboards (The copy part needs a Punch account)
Two ways to share:
Static Layout shares your setup exactly as it looks right now. Your future changes stay private.
Live Layout lets viewers follow along in real time. Everything you change updates for them instantly.
A shared link carries your charts, indicators, and drawings, and nothing else. Your positions and P&L, orders, funds, watchlists, and option chain are never part of it.
This works well for educators and teachers running a class, or for a group of friends who want to break down the same setups together.
When you need to stop your sharing, tap on Share → Manage Shares and switch any share off or delete it entirely.
How to access: Share → Share Layout to create a link. Share → Manage Shares to pause or delete one.
Fixes and polish
In our previous changelog, many of you raised pertinent questions about the reliability and performance issues on Punch. We're systematically clearing these out while we develop the AI products we promised. Here's what's fixed this time:
Option Chain no longer shows up blank. It loads reliably now.
Fixed crashes on order placement, SL/TP, and Add Funds.
Fixed biometric login getting stuck in a loop.
The app starts up around 15% faster and runs smoother.
And a few smaller quality-of-life touches:
The Scalper preset now shows quantity in both lots and broker qty.
Smoother snapping when you're drawing on charts.
Press Esc to quickly close any popup.
What's next
Three more AI products are coming over the next few weeks: Next up is the Punch Journal.
Stay tuned.
— Archit
June 24th, 2026
The two features we've promised for months are now live for everyone, on Desktop and Android. Both were built in-house and needed a backend rebuild plus a month of exchange approvals hence the delay. There's a third addition too: two trade forecasting tools.
Trailing SL
A normal stop loss stays put, so you end up dragging it up by hand to lock in a winning trade and giving back profit the moment you look away. Trailing SL follows price as it moves in your favour, at a distance you set in points, and never moves back against you.
Set it in the protection form, or tap the new +Trail box next to the SL on your chart. Once it's on, your SL label becomes TSL and the line trails on its own. It runs on our backend, so it keeps working even if your connection drops.
How to access: Protection form, or the +Trail box on the SL line.
Protection for equity
Until now, Protection was an F&O-only feature. This week it comes to equity.
After an intraday (MIS) order fills, the position shows Not Protected in red. You can either Tap Protect from the three-dots menu on your position card or you can simply set your SL/TP by drag and drop directly on the chart itself.
Long & Short Position tool
A new Forecasting menu in the left toolbar, with two tools to plan a trade before you place it.
Drop a Long Position on the chart and set entry, target, and stop. The reward zone shows green, the risk zone red, and the labels give you the distance in points and percent, the rupee amount for your quantity, the risk-to-reward, and a live Open P&L. Drag any line and it all recalculates. Short Position is the same, flipped.
How to access: Left toolbar → Forecasting → Long Position or Short Position.
See you at the Lab.
— Archit
June 17th, 2026
Let me start with what you care about most. I will not bury it. From 30 June 2026, brokerage on Punch moves from ₹1 to ₹10 per executed order, across equity, futures, and options.
I know what that number feels like. Many of you came to Punch for ₹1, and some opened more than one account for it. You have every right to ask why, and whether you can still trust us.
What ₹1 was for
₹1 proved a mission: pro-grade trading for every Indian trader. Over time it became part of the promise itself, and many of you planned around it, which we do not take lightly.
And it worked. In eight months, order volume grew 6X and active traders grew 5X, while Builder's Lab crossed 2,700 posts and 5,300 votes, built alongside you. That chapter is complete, and the next costs more to build.
Why ₹10, and why now
For six months we have tested what AI can really do for a trader, not the hype but the real thing. We met traders, broke things, and learned where it helps.
AI is everywhere, but free AI is unreliable, paid AI is expensive, and none of it knows your trades. Building AI that is accurate and affordable for Indian traders takes real, expensive infrastructure. ₹1 is enough to run a trading platform, but not enough to invest in the AI mission. ₹10 gives us that base, with nothing hidden behind it. We chose the honest path: a fair price, built in the open.
The AI mission
The mission is simple: AI that is accurate, reliable, and affordable, made for how Indian traders trade. ₹10 invests in it. Over the next few weeks it ships as four products, led by Punch AI.
Punch AI. Reads your charts, learns your style, and helps you scan, alert, and back test.
Research Desk. Institutional-grade briefings before, during, and after market hours.
Trading Journal. Dissects your trades, surfaces your patterns, and coaches you.
Pine Script on Punch. Paste any script and AI plots it on your charts.
The core Punch AI is included in your brokerage; only the advanced, heavy-compute features are an optional paid add-on.
Now let me answer what you asked in the webinar
"I don't use AI. Why should I pay?" Because AI is the next big step in trading, and we have a track record of getting there first: native charts in 2016, single-screen trading in 2023. ₹10 lets us invest in the AI mission and build it for you. Even if you never touch AI, the platform keeps getting better for everyone.
"Can I opt out, or get a cheaper plan?" Not from ₹10; it is the flat default for every trader. But scalpers and high-frequency traders feel this most, as per-order cost adds up fast for them. We are thinking hard about monthly subscription plans built for them.
"Fix the basics first." Fair. Chart speed, withdrawals, and execution must be rock solid. Those are ours to fix, not yours to put up with, and we are on them.
"Is this a bait and switch?" No. ₹1 was never a trap to pull you in and raise the price later; it was a real experiment that paid off. We are raising it to build what comes next, and telling you why first.
Where we go from here
The ambition that built native charts and single-screen trading now goes to AI. That is the company you backed at ₹1, and it is the same company at ₹10.
Thank you for trading with us, and for being honest. We will keep earning it.
Amit Dhakad
Founder and CEO, Punch
June 10th, 2026
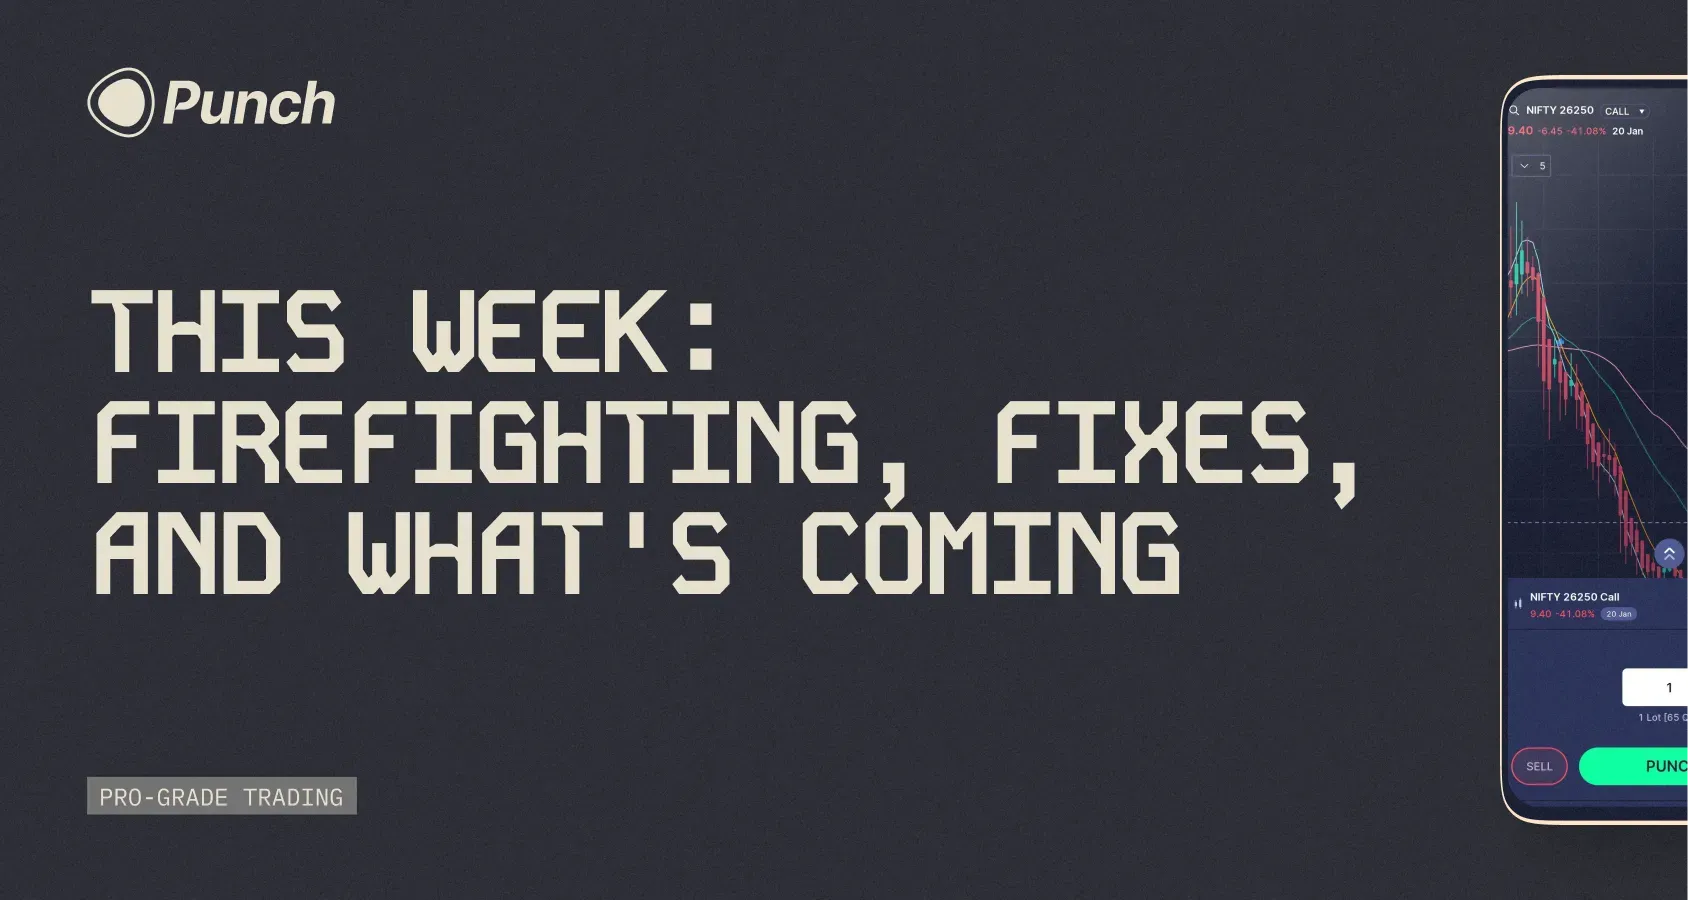
This week at Punch has largely been about fixing issues many of you have raised on the Builder's Lab and through support. So instead of a feature walkthrough, I wanted to take you behind the scenes on what's been cooking under the hood.
Last week I mentioned we were rolling out two long-awaited features: Trailing SL and Protection for equity. Both have been built in-house from the ground up, and shipping them required a significant architectural change to our backend. That work took longer than we expected, and approvals at the exchange sat with us for almost a month.
When we were finally ready to release, we made a deliberate call. Rather than push both features to thousands of traders at once, we'd start with a small group and watch closely for issues. This is how most software teams ship changes of this size, and we're glad we did it this way. We hit a snag this morning and had to pause the rollout. Today was a day of firefighting on our end, working through the issues and getting the rollout plan back on track.
We're aiming to have both features fully available to everyone by the weekend.
On the lag many of you noticed on the charts yesterday: that was an API issue on one of our data sources. It's now fixed. Things should feel back to normal.
Two more things worth sharing before I sign off.
One, there's a first-of-its-kind feature releasing on Punch this week: Shareable Dashboards. I'd rather not say more until you've seen it for yourself. I'll write a proper note next week once it's in your hands.
Two, the Scalper Joystick on Punch Desktop is built and ready. The team is running live testing over the next few days, and we'll release it shortly after.
Until next week
-Archit
June 3rd, 2026
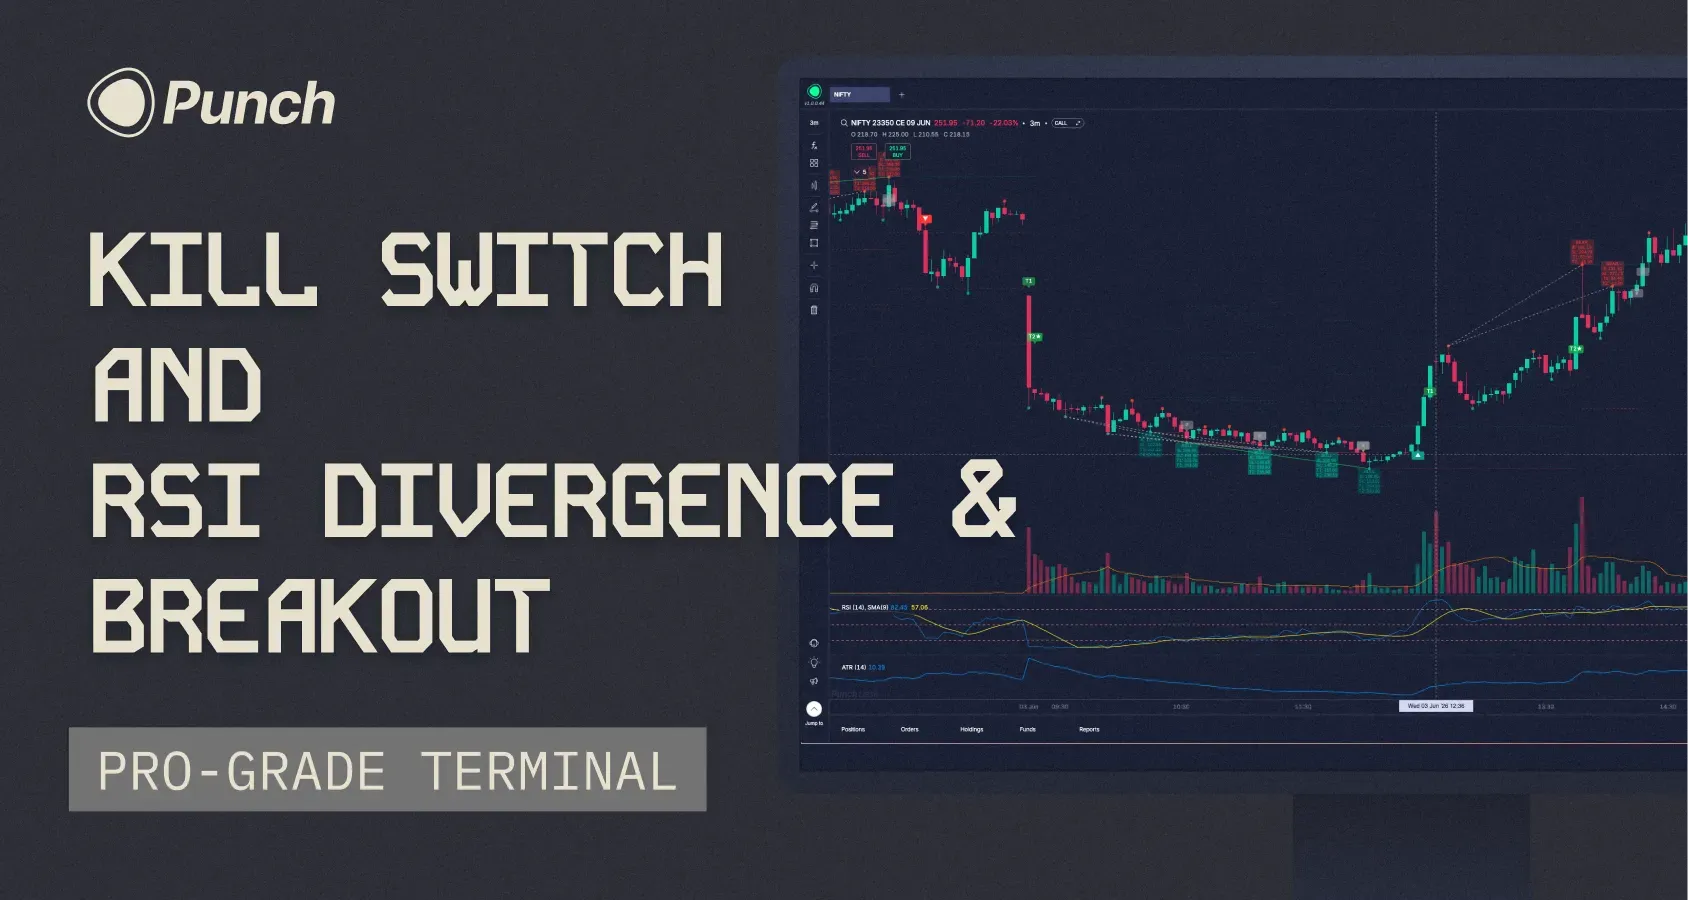
With more than 300 votes on Builder's Lab, Kill Switch has been one of the most requested features on Punch.
Today, we're excited to launch Kill Switch, along with two other major additions. This is one of our biggest release weeks yet.
Let's get to it.
Introducing Kill Switch
There are days when the best thing you can do is stop trading. Kill Switch is built for those moments.
You can now temporarily lock yourself out of trading directly from the Jump-To menu. Choose whether to disable Equity, F&O, or both, and select a duration of 1, 2, 4, 6, or 8 hours.
Once activated:
All pending orders are cancelled.
Open positions are squared off.
New orders in the selected segments are blocked until the timer expires.
A few things worth knowing:
Kill Switch is irrevocable once activated. There is no early exit.
It automatically resets when the selected duration ends.
It syncs across devices in real time.
It can only be activated during market hours.
You can continue to access charts, watchlists, portfolios, and option chains. Only order placement is restricted.
We hope Kill Switch helps traders avoid the costly mistakes that often come from emotional decision-making.
Next up is one of the most requested indicators on Builder's Lab—and a Punch exclusive built entirely in-house.
RSI Divergence & Breakout
This indicator combines two ideas.
First, it detects bullish and bearish RSI divergences. Second, it waits for price to confirm the setup with a breakout before generating a signal.
A lot of divergences look great on a chart but never play out. The breakout filter helps separate genuine opportunities from noise.
Once a signal triggers, the indicator automatically plots:
Entry
Stop Loss
Target 1
Target 2
It then tracks the setup through its lifecycle and marks the final outcome directly on the chart.
You can customize RSI parameters, pivot detection, breakout confirmation windows, stop-loss and target behaviour, and signal management settings.
How to access: Indicators (Fx) → Search "RSI Divergence & Breakout"
Trade Directly From The Chart
This one is a small feature, but it can make a meaningful difference to your workflow.
Imagine you're looking at a chart and decide you want to buy NIFTY 23950 CE at ₹154.25.
Previously, you'd open the order form, change the order type, enter the price, and then place the trade.
Now, simply right-click on the chart at your desired price.
You'll see options to:
Buy at this price as a limit order
Sell at this price as a trigger order
The price you clicked is automatically populated. Review the order, adjust quantity if needed, and place it.
Fewer clicks. Faster execution.
And that's it—three new features designed to give traders more control, better signals, and a faster workflow.
One more thing.
We're rolling out Trailing SL this week.
This feature has taken longer to build than we expected, but it's finally ready.
Keep an eye on next week's changelog
Trailing SL is coming. And so is another surprise.
See you next week.
— Archit
May 27th, 2026
Hey traders,
A theme has been emerging on the Builder’s lab over the last few weeks. People aren't asking for big new features, except a few which are already under development. They're asking for control over what's already there. Make my chart background lighter. Let me set my own time interval. Let me put text on a Fib. Small things that change how it feels to use Punch for 6 hours straight.
This week's release is mostly about that.
Chart customisation, properly
Until now, the only thing you could change on the chart itself was candle colours. Everything else (background, grid lines, the scales, the empty space around your candles) was locked to our defaults. Some of you have been writing in about this for a while.
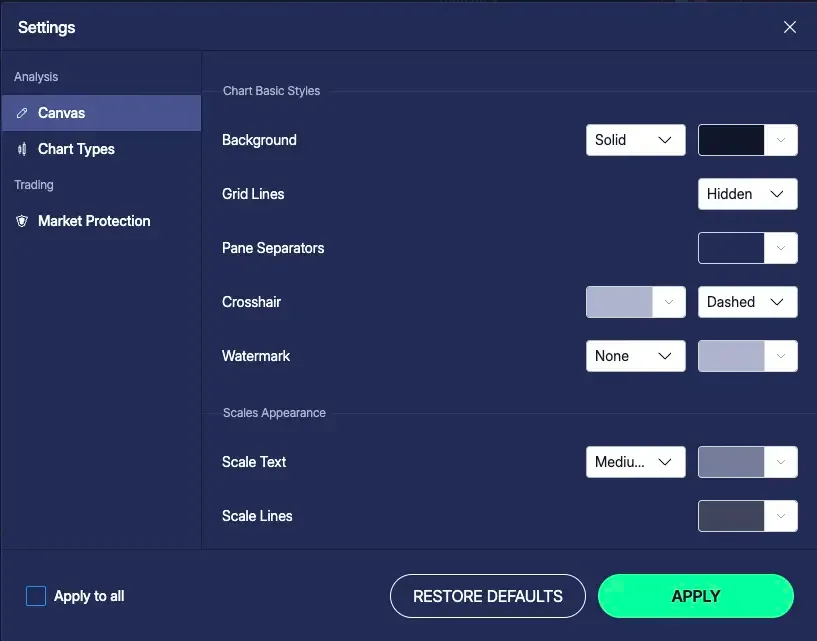
That's open now. There's a new Chart settings panel with sections for:
Chart Basics. Background colour and style (solid or gradient), grid lines, pane separators, crosshair colour and style, watermark.
Scales. Text size and colour for axis labels. Line colour for the scale itself.
Buttons. Show or hide the navigation arrows on the chart.
Margins. Top and bottom margins as a % of chart height. Right margin in bars, so you can leave room to project lines past the latest candle.
Chart Type Settings. The existing one. Candle colours, borders, hollow candles.
The bigger shift is that settings are now scoped per canvas. Change one canvas in your dashboard without it cascading to every chart you've ever opened. There's an "Apply to all canvases in this dashboard" checkbox next to APPLY if you do want the change to spread.
Trend-Based Fib Extension
If you trade pullbacks, you've probably been using Fib Retracement to find where a correction might end. The Trend-Based Fib Extension answers the other half of that question: where might price go after the pullback ends?
Three clicks instead of two. Point A is the start of the impulse move, B is the end, C is where the pullback completed. The tool projects extension levels from C using the A-to-B distance. 0.236, 0.382, 0.618, 1.0, 1.618, 2.618, all the standard ratios.
How to access: Drawing toolbar → Fibonacci → Trend-Based Fib Extension.
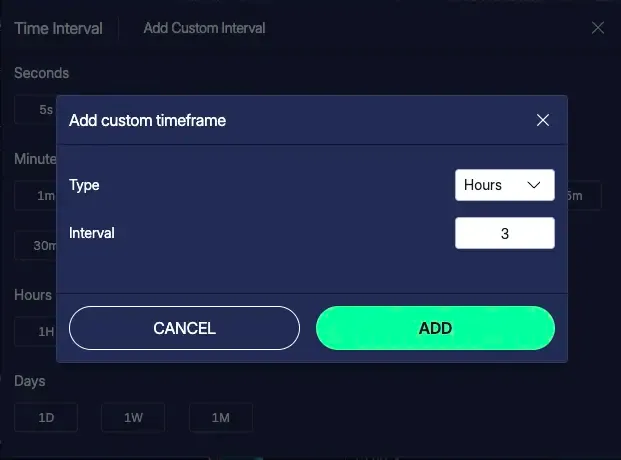
Custom time intervals
The fixed preset list (1m, 5m, 15m, 30m, 1H, and so on) has been a recurring ask. If your strategy runs on a 7-minute candle or a 3-day candle, you've had to either change your strategy or trade somewhere else.
Now you can set your own. Tap "+ Custom" in the time interval picker, enter a number, pick the unit (minutes, hours, or days), and save. Up to 10 custom intervals can be pinned alongside the presets, synced across your devices.
NOTE : Integers only for now. No 1.5H or 2.5m.
Until next week. See you at the lab.
— Archit
May 20th, 2026
Hey everyone,
Drawing tools have quietly become one of the most used features of Punch Desktop. Trendlines, Fibs, rectangles, rays — a lot of you are building entire trading workflows around them now.
But over time, charts start getting messy. You forget why a line was drawn, which rectangle marked the entry zone, or what that Fib was tracking. Eventually you either rely on memory or wipe the chart clean and start over.
This week’s release is focused on solving that.
Drawing Pen on Desktop
Until now, drawings on Punch were mostly structured — straight lines, rectangles, Fibs, etc. But sometimes you just want to quickly circle a pattern, sketch out a rough zone, or mark up a chart freely the way you would on paper.
You can now do that with the new Drawing Pen.
Just select the pen tool and draw directly on the chart canvas. Every stroke becomes its own editable object, so you can move it, resize it, recolour it, or delete it individually. Colour, width, and opacity are fully customizable.
How to access: Left-side drawing toolbar → Pen icon.
Text Labels on Drawings
The second long-pending addition — labels on drawings.
You can now double-click supported drawings and attach text directly to them. So instead of trying to remember why a level mattered, you can simply label it “Daily Resistance”, “Trap Zone”, “Entry”, or anything else relevant to your setup.
Multi-line labels are supported, and label styling can be customized from the drawing settings panel.
How to access: Double-click any supported drawing.
Other smaller updates
Search inside Indicators panel on Android
Rectangle & Rotated Rectangle now also released on Android
Plot up to 3 instances of pivot indicators on the same chart
Bigger colour palette for indicators & drawings on Desktop
Bug fixes
Opening the Option Chain from the Jump-To menu was occasionally giving you a blank screen. Fixed.
Login OTP reliability. A few people had been hitting flaky OTP delivery on login. Worked through the underlying issues with our provider, should be solid now.
See you next Wednesday.
– Archit
May 13th, 2026
What's new
A piece of feedback I’ve heard repeatedly from Builder's Lab: "My SL gets filled too far from my trigger. Why can't I tighten that?"
Fair point. On every trigger order, Punch was calculating a limit price behind the scenes: 5% from trigger for options, 1% for equity and futures. You couldn't see it. You couldn't change it.
This week's main release fixes that. The other change brings Magnet Mode to Desktop.
Market Protection, now visible and adjustable
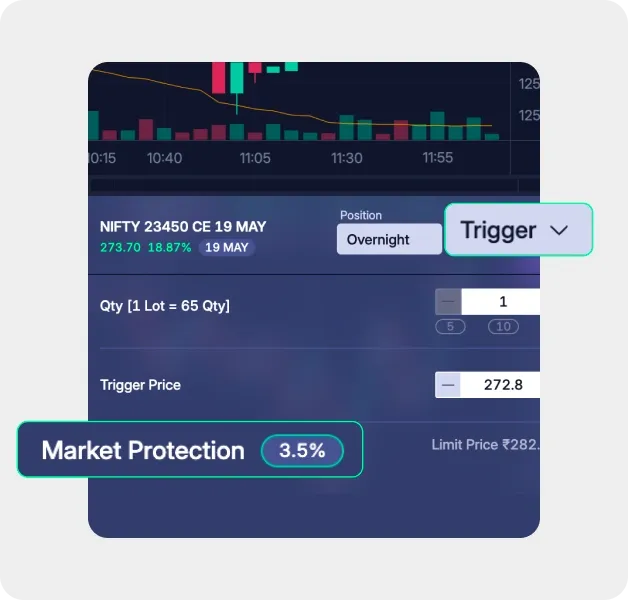
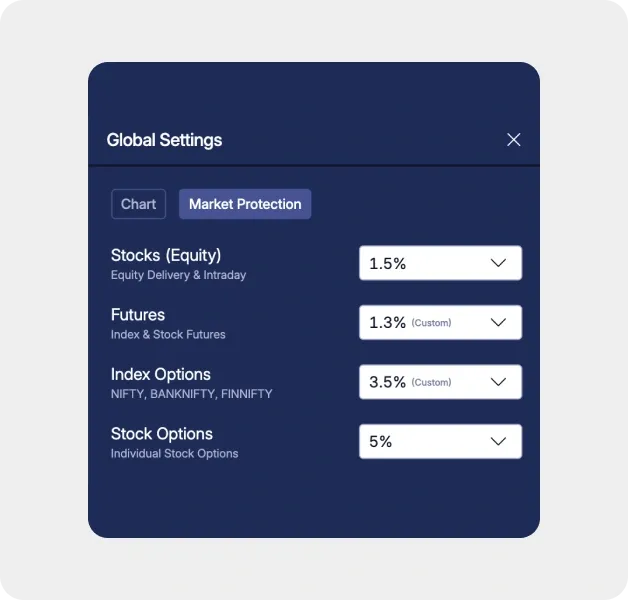
There's a new Market Protection section in Settings. Set your preferred % per instrument type (Stocks, Futures, Index Options, Stock Options) once. It applies to every trigger order you place for that type. Range is 0.1% to 10%. System defaults stay at 1% and 5% if you don't touch it.
On every order form (standalone trigger, SL leg, TP leg), you'll now see a one-line row below the trigger price showing the active % and the computed limit price. Tap it to override for this trade only. Pick from chips (0.5%, 1%, 2%, 3%, 5%) or enter a custom value. The override doesn't get saved back to Settings. The next order goes back to your default. To save your market protection % preference, go to global settings → switch over to the “Market protection“ tab and save you preferred % per instrument type.
A higher protection % gives your SL more room to fill in a fast-moving market whilst a lower % keeps fills tight to the trigger. You decide where on that curve you want to sit, per instrument type, per trade.
How to access: Settings → Market Protection. Or tap the protection row on any trigger order form.
Magnet Mode on Desktop
Drawing a trendline from one candle high to another used to require zooming in and squinting. Magnet Mode fixes that.
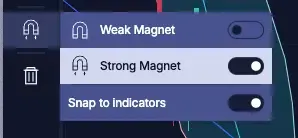
Drawing anchors now snap to candle OHLC values automatically. Click the magnet icon on the left toolbar to open the submenu and choose a mode:
Weak snaps only when your cursor is close to an OHLC value. Otherwise places freely.
Strong always snaps to the nearest OHLC, regardless of where you click.
Works across every drawing tool with anchor points: Trend Line, Extended Line, Horizontal Line, Horizontal Ray, Vertical Line, Fib Retracement, Rectangle, and Rotated Rectangle.
There's also a Snap to Indicators toggle in the same submenu. Turn it on and anchors snap to indicator values on the chart too: EMA, SMA, Bollinger Bands, Supertrend, VWAP, and anything else plotted. The system picks whichever target (OHLC or indicator) is closest to your cursor. Useful for drawing trendlines off a moving average or marking exactly where price touched VWAP.
How to access: Magnet icon on the left drawing toolbar.
See you at the Lab.
– Archit Sunat