Introducing : Trade-wise PnL on Punch
🚀 What’s New
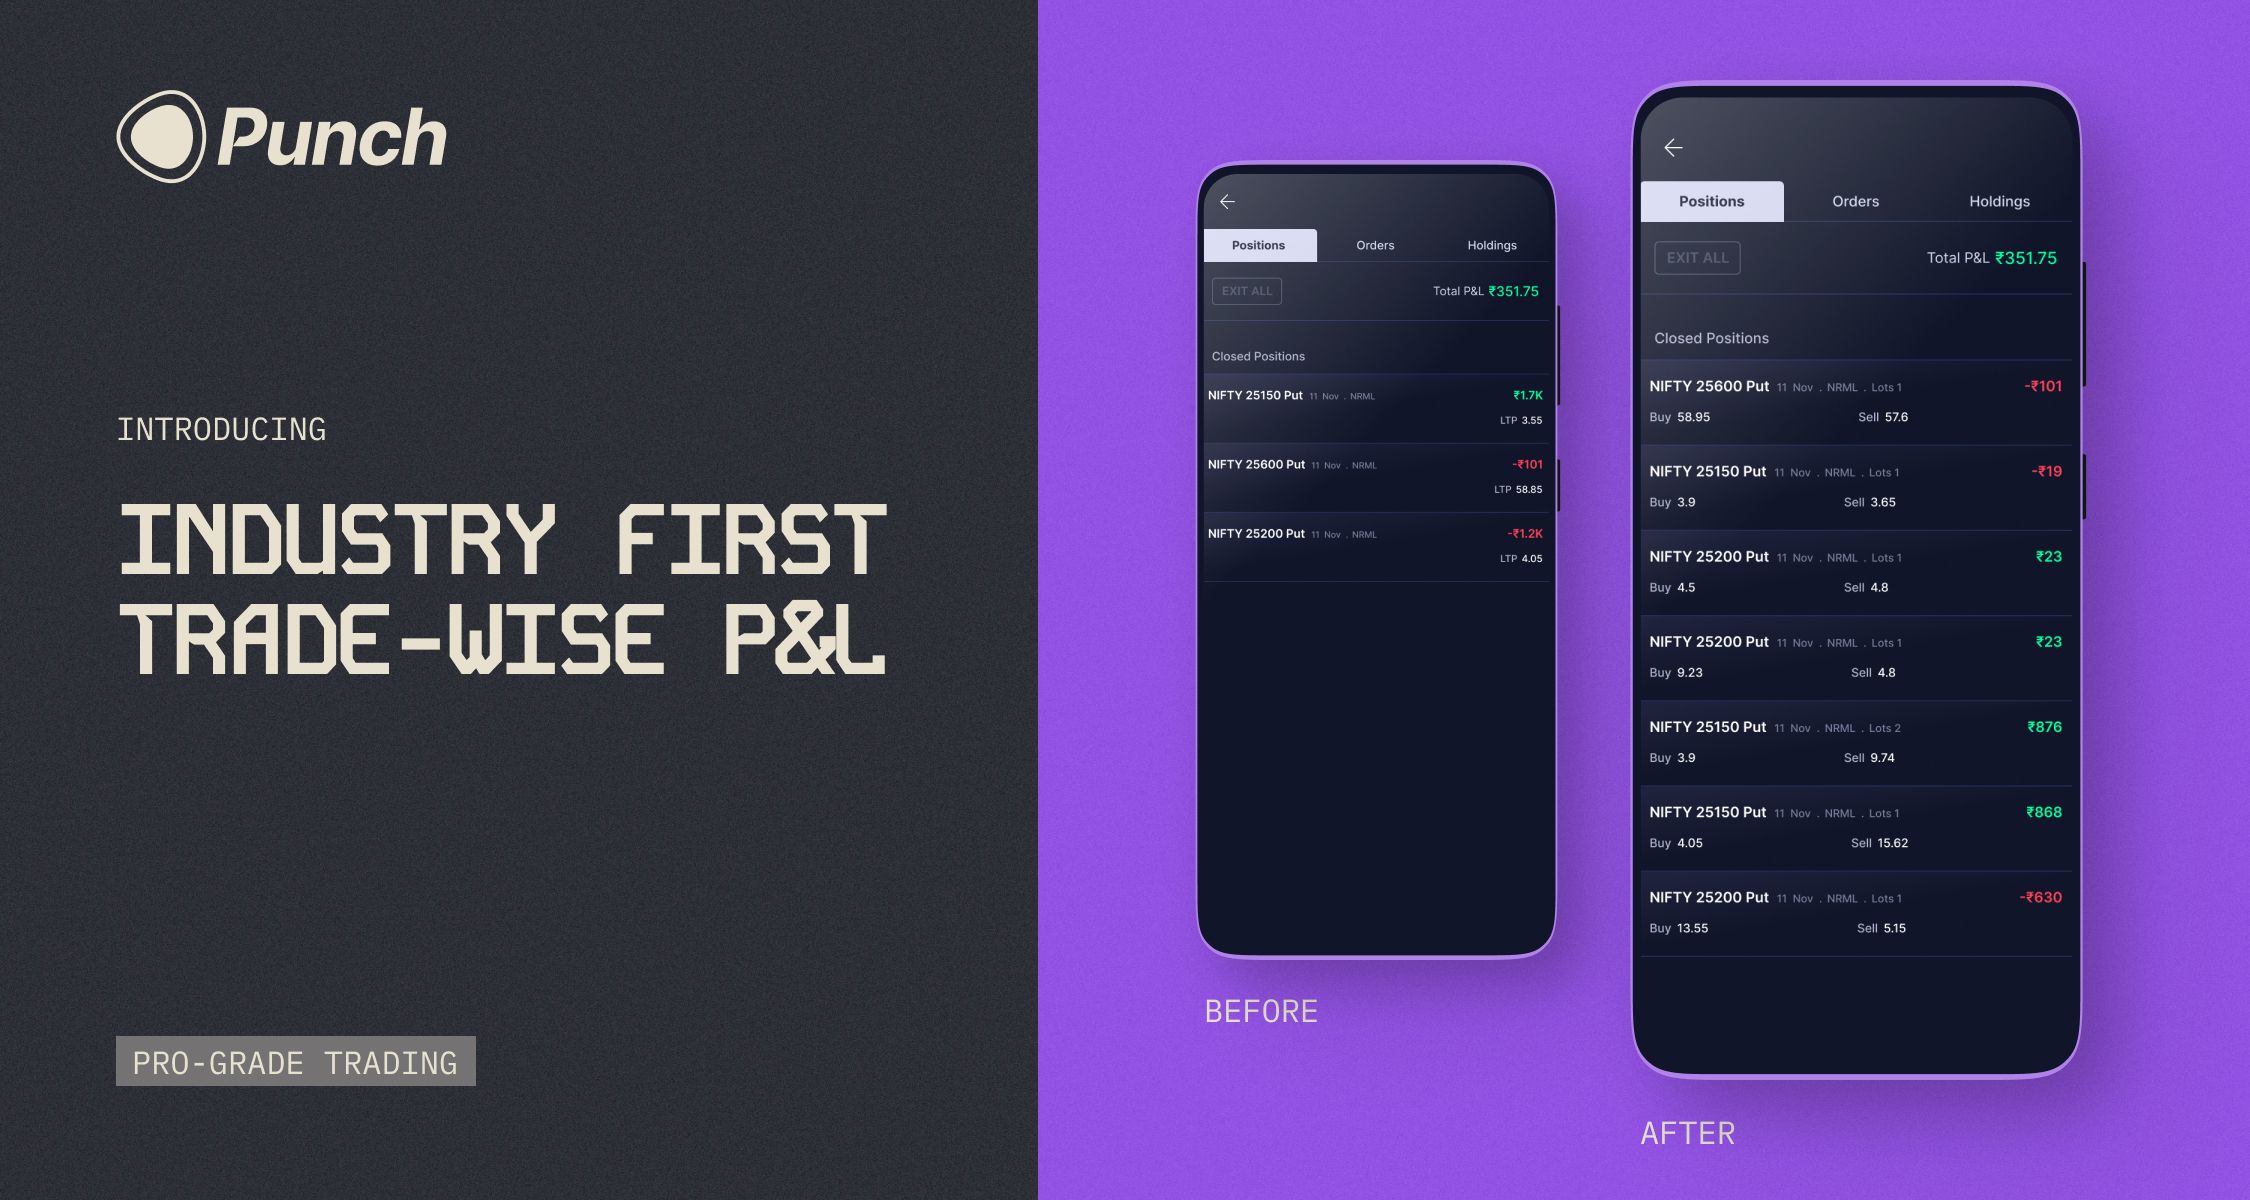
We’re launching Trade-wise P&L, a first-of-its-kind way to view your profits and losses — where every entry–exit cycle becomes its own trade with its own P&L.
Instead of showing the average price across multiple trades (which hides actual performance), your P&L is now shown per trade. Clear. Transparent. Tailored for intraday and scalping.
🧠 Why We Changed It
Traditionally, platforms show P&L based on average prices of a position — a mix of open and closed trades. This was a flawed system:
❌ Hides your actual trade performance
❌ Makes P&L unclear
❌ Is not suitable for fast-paced intraday or scalping trades
This meant traders couldn’t easily tell which trades worked — and which didn’t.
✅ What’s Better Now
With Trade-wise P&L:
Every buy–sell or sell–buy pair is treated as a distinct trade
P&L is shown individually for each trade
It works beautifully for intraday, scalping and high-frequency traders
👀 See It in Action
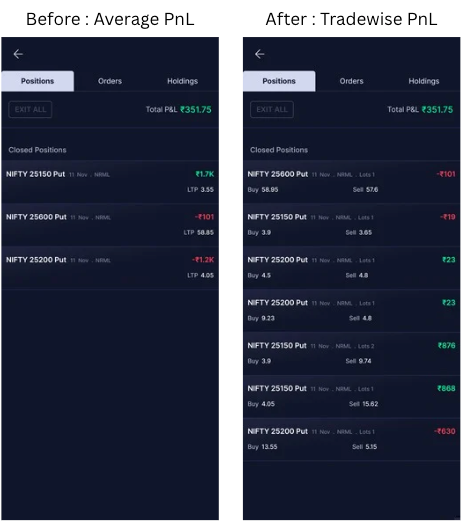
📉 Before: Average Price Method
Multiple trades were clubbed together using an average entry price.
Example: Three trades in NIFTY 25150 Put are grouped as one, showing a single P&L of ₹1.7K — making it unclear which trade actually performed how.
✅ After: Trade-wise P&L (New)
Each buy-sell pair is treated as an individual trade with its own P&L.
Now you can see:
One trade in NIFTY 25150 Put → ₹868 profit
Another in the same scrip → ₹876 profit
A smaller trade → ₹-19 loss
No more hiding real performance behind averages.
💬 Built on Builder’s Lab
This feature was directly inspired by repeated feedback from traders. You asked for accurate P&L visibility — and it’s finally here.