What's New

Follow new updates and improvements to Punch Builder's Lab.

May 20th, 2026

Hey everyone,

Drawing tools have quietly become one of the most used features of Punch Desktop. Trendlines, Fibs, rectangles, rays — a lot of you are building entire trading workflows around them now.

But over time, charts start getting messy. You forget why a line was drawn, which rectangle marked the entry zone, or what that Fib was tracking. Eventually you either rely on memory or wipe the chart clean and start over.

This week’s release is focused on solving that.

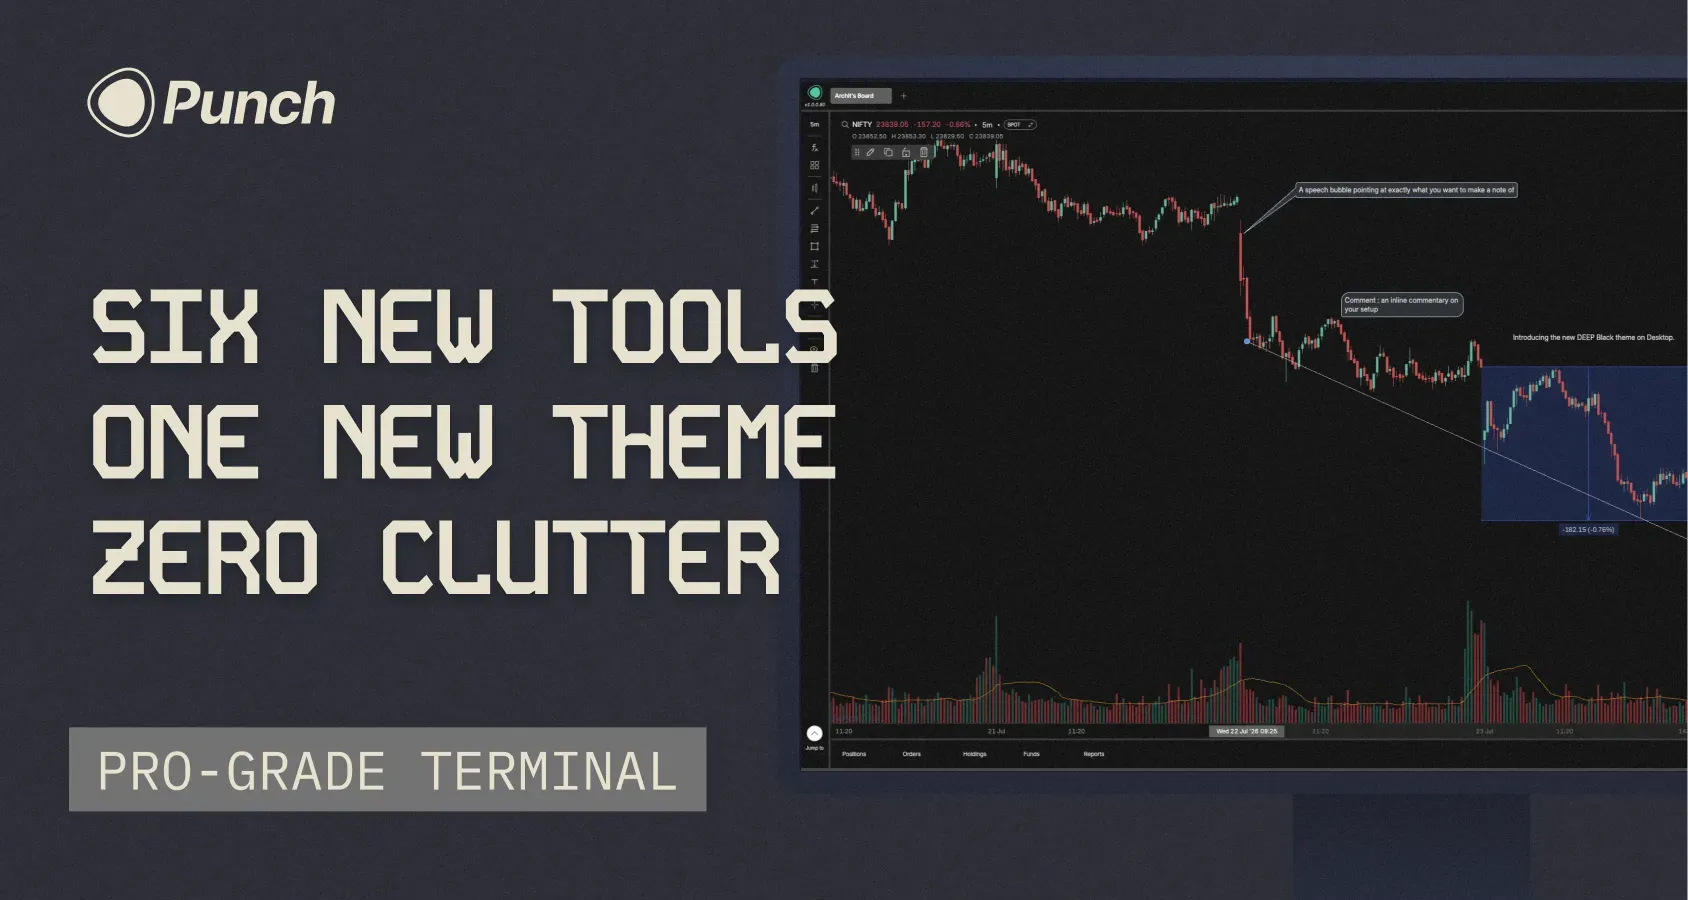
Drawing Pen on Desktop

Until now, drawings on Punch were mostly structured — straight lines, rectangles, Fibs, etc. But sometimes you just want to quickly circle a pattern, sketch out a rough zone, or mark up a chart freely the way you would on paper.

You can now do that with the new Drawing Pen.

Just select the pen tool and draw directly on the chart canvas. Every stroke becomes its own editable object, so you can move it, resize it, recolour it, or delete it individually. Colour, width, and opacity are fully customizable.

How to access: Left-side drawing toolbar → Pen icon.

Text Labels on Drawings

The second long-pending addition — labels on drawings.

You can now double-click supported drawings and attach text directly to them. So instead of trying to remember why a level mattered, you can simply label it “Daily Resistance”, “Trap Zone”, “Entry”, or anything else relevant to your setup.

Multi-line labels are supported, and label styling can be customized from the drawing settings panel.

How to access: Double-click any supported drawing.

Other smaller updates

  • Search inside Indicators panel on Android

  • Rectangle & Rotated Rectangle now also released on Android

  • Plot up to 3 instances of pivot indicators on the same chart

  • Bigger colour palette for indicators & drawings on Desktop

Bug fixes

  • Opening the Option Chain from the Jump-To menu was occasionally giving you a blank screen. Fixed.

  • Login OTP reliability. A few people had been hitting flaky OTP delivery on login. Worked through the underlying issues with our provider, should be solid now.

See you next Wednesday.

– Archit

May 13th, 2026

What's new

A piece of feedback I’ve heard repeatedly from Builder's Lab: "My SL gets filled too far from my trigger. Why can't I tighten that?"

Fair point. On every trigger order, Punch was calculating a limit price behind the scenes: 5% from trigger for options, 1% for equity and futures. You couldn't see it. You couldn't change it.

This week's main release fixes that. The other change brings Magnet Mode to Desktop.

Market Protection, now visible and adjustable

There's a new Market Protection section in Settings. Set your preferred % per instrument type (Stocks, Futures, Index Options, Stock Options) once. It applies to every trigger order you place for that type. Range is 0.1% to 10%. System defaults stay at 1% and 5% if you don't touch it.

On every order form (standalone trigger, SL leg, TP leg), you'll now see a one-line row below the trigger price showing the active % and the computed limit price. Tap it to override for this trade only. Pick from chips (0.5%, 1%, 2%, 3%, 5%) or enter a custom value. The override doesn't get saved back to Settings. The next order goes back to your default. To save your market protection % preference, go to global settings → switch over to the “Market protection“ tab and save you preferred % per instrument type.

A higher protection % gives your SL more room to fill in a fast-moving market whilst a lower % keeps fills tight to the trigger. You decide where on that curve you want to sit, per instrument type, per trade.

How to access: Settings → Market Protection. Or tap the protection row on any trigger order form.

Magnet Mode on Desktop

Drawing a trendline from one candle high to another used to require zooming in and squinting. Magnet Mode fixes that.

Drawing anchors now snap to candle OHLC values automatically. Click the magnet icon on the left toolbar to open the submenu and choose a mode:

Weak snaps only when your cursor is close to an OHLC value. Otherwise places freely.

Strong always snaps to the nearest OHLC, regardless of where you click.

Works across every drawing tool with anchor points: Trend Line, Extended Line, Horizontal Line, Horizontal Ray, Vertical Line, Fib Retracement, Rectangle, and Rotated Rectangle.

There's also a Snap to Indicators toggle in the same submenu. Turn it on and anchors snap to indicator values on the chart too: EMA, SMA, Bollinger Bands, Supertrend, VWAP, and anything else plotted. The system picks whichever target (OHLC or indicator) is closest to your cursor. Useful for drawing trendlines off a moving average or marking exactly where price touched VWAP.

How to access: Magnet icon on the left drawing toolbar.

See you at the Lab.

– Archit Sunat

May 6th, 2026

The loudest piece of feedback after we launched Key Levels and Pivot Points on Android was: we want them on Desktop too.

So here they are, with a quick refresher on what they do.

Key Levels covers six timeframes — intraday, daily, weekly, monthly, 52-week, and Monday range — with OHLC and midpoint as toggleable levels, each with its own colour, width, and style.

Pivot Points has been split into Standard, Fibonacci, and Camarilla as standalone indicators, with CPR as its own entry. Plot any combination simultaneously instead of picking one from a dropdown.

Full notes from the original release here.

Delete all drawings and indicators in one click

Removing drawings used to be a one-by-one task. Tap a trendline, delete. Tap the next one, delete. On a busy chart, this got tedious fast.

The trash icon now clears everything in one tap. It also counts what's on the chart and lets you choose — drawings only, indicators only, or both. So if you want to keep your trendlines but wipe the indicators, that's one tap instead of opening the indicators panel and removing them individually.

Locked drawings are protected by default. There's an "Always remove locked drawings" toggle in the same menu if you'd rather skip the protection.

How to access: Trash icon on the chart toolbar.

💬 What's next

That's all for today. A few things are cooking in the Punch oven:

  • Search inside the indicators panel

  • Trailing stop loss

  • Protection for equity trading

  • Configurable market protection % for trigger orders

  • A ± stepper input to replace the scroll wheel when setting SL/TP

All of the above are expected to be released in the next couple of weeks.

See you at the Lab. 

— Archit Sunat

April 29th, 2026

What's new

This week we have two important releases: Indicator Templates and candle customisations.

A few weeks ago I was speaking with a few users to understand their experience trading on the newly launched desktop terminal. And although the multi-chart layouts and multi-dashboard support were well received, one fundamental issue became a huge friction point.

Traders mentioned that they had to replicate the same setup of indicators and timeframes every time they would create a new dashboard or even change symbol within a dashboard. This had become a very tedious process.

Hence, we have launched Indicator Templates. A simple but significant feature that lets you set up your indicators the way you like — EMA, VWAP, RSI, whatever combination you trade with. Save it as a named template. Next time you open a chart or switch scrips, one click brings back your entire setup. No re-adding indicators, no reconfiguring colours and settings.

You can optionally lock a template to a specific scrip or timeframe. So a "BankNifty 5m Scalper" template can switch your chart to BankNifty on 5-minute automatically when loaded.

Favorite your most-used templates for one-click access from the toolbar. Punch also ships with a set of default templates for common setups — F&O scalping, swing trading, equity day trading — so you have a starting point even before you build your own.

Templates sync across devices.

The second big update is that we have brought the candle customisation feature over from Android. You can now set separate colours for body up and body down, toggle candle borders on or off with independent border colours, and switch to hollow candles. Changes apply globally across all your charts.

There were also a couple of minor bug fixes on holdings calculation and a UI fix for the Squeeze Momentum indicator.

Till next week. Keep posting on Builder's Lab and guide Punch in the direction you want.

— Archit

April 23rd, 2026

This week's update touches both Android and desktop. A redesign, a feature port, a catch-up fix, and a new way to stay updated.

P&L Pill Redesign

This came directly from conversations I've had with traders over the past couple of weeks. The P&L pill on your chart (for both options and equity) has been redesigned. It now shows a colour-coded lot count, P&L value, and an exit button. The yellow colour code on the lot count represents a call whilst the blue depicts a put. 

Heatmap View on Android

We launched heatmap view on desktop a few weeks ago and the response was good. It's now on Android too.

Toggle it on from the icon in the top right of the watchlist menu. Heatmap sorts and groups any of your watchlists by price % change. Each scrip is colour-coded: shades of green for positive, shades of red for negative. The darker the shade, the larger the move.

Holdings on Desktop

Desktop has been playing catch-up with Android, and we had intentionally deprioritised some features knowing you could always check them on mobile. Holdings was one of them. That's now live. You can check your holdings directly on Punch Desktop now. 

What's New Widget on Desktop

We update the app frequently based on Builder's Lab feedback and direct conversations with users. The changelog and roadmap are always available on Builder's Lab, and we share a weekly email too. But some of you told us you still weren't able to track the updates. 

So we built an in-app What's New widget on Android a while back. This release brings the same to desktop, covering desktop-specific updates.

Bug Fixes

Spot price freeze: a few of you reported the spot price not updating while option prices were unaffected. We're actively fixing this and it should be resolved by 24th April.

Option chain loading: there's a known issue with the option chain not loading correctly. If you face this, please report it on Builder's Lab or reach out to the support team for a quick resolution.

Key Levels indicator: we've added a larger font size option to improve readability. You can select the size from the indicator settings menu.

Duplicate candles: fixed a bug causing duplicate candles on certain timeframes.

— Archit

April 15th, 2026

This is one of those weeks where I am really pleased to post a changelog. All 4 of these features have been in the builder’s lab and in my conversations with users and finally all of them are live now.

Let’s get started.

Zig Zag Indicator

I get a ton of requests for new indicators on Punch but this one was by far the most requested one. Zig Zag indicator connects swing highs and swing lows with straight lines, filtering out the noise in between. You can customize the indicator by setting the price deviation threshold (default 1%) and a pivot depth (default 5 bars). Moves smaller than your threshold get ignored, leaving you with just the trend structure.

This is available on Android now and will be on desktop by this weekend

Option Price Charts in All Timeframes

Option price charts were previously limited to timeframes of 1 hour and below. That restriction is removed. You can now view option price charts across every timeframe available on Punch.

If you trade positional options or want to see how premiums have moved over days and weeks, this was a gap. It's filled.

Available on both desktop and Android now.

Rectangle Drawing tool

This one got hundreds of votes : Rectangle tool

The standard rectangle tool can be used to mark consolidation zones, price ranges, or areas of interest. It comes with full customizability for border colour, thickness and style, along with fill opacity control and extend left/right toggles.

The rotated rectangle variant is more suited for marking diagonal channels or angled consolidation patterns that don't sit horizontally.

Chart controls

This one is specific for Punch desktop users.

Desktop charts now have dedicated zoom (+/-) and scroll (left/right) controls that appear when you hover over the chart in addition to the recentre icon you're already familiar with.

That’s all for today.

We're working through the other requests on Builder's Lab. A few more drawing tools, trailing SL, protection order for equity, and kill switch are all under development right now.

- Archit

April 8th, 2026

Two quick updates this week and both of them have been highly requested & long pending on the Punch Builder’s Lab

Key Levels Indicator

The old Key Levels only showed previous day high and low. We’ve changed that. The new one covers six timeframes: intraday (configurable from 1h to 4h), daily, weekly, monthly, 52-week, and Monday range.

For each timeframe you get open, high, low, close, and midpoint as separate toggleable levels. So you can plot previous day high/low alongside previous week high/low alongside 52-week high/low on the same chart, each in a different colour.

Every timeframe has its own colour picker with opacity control. Line width and style (solid, dashed, dotted) are configurable. Labels can be switched between long form ("Prev Day High") and shorthand ("PDH"). There's also a merge option that combines identical levels across timeframes so your chart doesn't turn into a mess of overlapping lines.

By default, daily and weekly previous high/low are turned on. Everything else is off. Customize what you need.

How to access: Indicators panel (Fx) → scroll to "Key Levels"

Pivot Points Restructure

Pivot Points was a single indicator with a dropdown to switch between Standard, Fibonacci, and Camarilla. That created a problem: you could only use one at a time.

We've split them into three standalone indicators. Standard Pivot Points, Fibonacci Pivot Points, and Camarilla Pivot Points are now separate entries in the indicator list. You can plot any combination of them simultaneously.

CPR (Central Pivot Range) is also now its own independent indicator. TC, PP, and BC plotted separately, no longer buried inside the Pivot Points dropdown.

How to access: Indicators panel (Fx) → scroll to "Camarilla Pivot Points” or “Central Pivot Range“

Both of these are live on Android now. We'll be adding the same indicators to Punch Desktop too in an upcoming release.

💬 Until next week

Every idea you suggest, every vote you cast, every bug you report — gets us closer to building Punch the right way.

See you at the Lab.

— Archit Sunat

April 1st, 2026

Desktop is evolving fast. Right now we're focused on building parity with the Android app.

Two updates for you on desktop this week.

Indicator Customisations

You can now customise your indicator style down to the detail.

When you plot an indicator and tap the colour option, you get 16 colour choices along with the ability to set the opacity.

You can customize the look and feel by adjusting line thickness, switching between three style options, and choosing to show or hide individual indicator values.

And you can select the source: open, high, low, close, HL/2, or HLC/3.

Market Depth

Like on Android, the order form on desktop now comes with a dedicated market depth view. Get a quick look at the bid and ask across 5 levels of depth. Market depth also shows the OHLC, OI, Volume, and upper/lower circuit for the respective strike.

How to access: on your order form, tap the Market Depth icon next to the order type.

Android: BSE cash Integration (Version: 2.0.0.87)

Till now Punch had access to all NSE indices and stocks along with BSE indices, but BSE cash was a missing piece. That's now filled.

How to switch: tap the NSE toggle next to the scrip name to switch to BSE and vice versa.

Coming Up

Protection orders for equity went into development this week. We're targeting end of month for release. Trailing SL is also in the pipeline for this month. I'll keep you posted.

— Archit

March 25th, 2026

Hello everybody,

This week I want to talk about 2 of the most awaited features on desktop.

Watchlists

With over 233 votes on Builder's Lab, watchlists became the top-voted feature. And we've released them with a multitude of capabilities, even more powerful than mobile. So all you watchlist keepers can take full advantage of it.

You can add, edit, remove, and reorder your scrips.

We have introduced 8 customizations in your watchlists with trackable, real-time data – LTP, price, price change %, open, high, low, close, and volume. You can use the settings button to select the columns you track regularly, or use all of them and spread the watchlist across the screen.

TIP: You should create a dashboard just for your watchlists.

You'll continue to have access to your beloved preset watchlists – NIFTY 50, NIFTY NEXT 50, and FnO watchlists.

Something that's not even released on Android yet – Watchlist Heatmaps. Switch from list view to Heatmap view to track your watchlist visually. Scrips are color-coded in red and green based on price movement, with varying shades to highlight the intensity of the move.

On hovering over any scrip inside a watchlist, you'll get two options:

  1. View chart — the respective scrip chart will open in your active chart layout.

  2. View option chain — you can switch over to the option chain of the respective scrip.

And lastly, all your watchlists created on mobile will be automatically synced across web and mobile.


New drawing tools

Until now on desktop, you only had access to horizontal lines, trendlines, and Fibonacci retracements. With this update, we have introduced 4 new drawing tools:

  • Vertical Line — for session boundaries and time-based references

  • Trendline Ray — draws a directional trendline extending forward from a single anchor point

  • Horizontal Ray — for projecting levels forward without extending both sides

  • Extended Line — for structure and trend projection beyond visible candles


Coming up next on desktop

In the next couple of weeks, expect: market depth, indicator customizations, holdings on desktop (currently only viewable on Android), and the OI profile indicator on chart.


Punch Android app (version 2.0.0.86)

We received great feedback and appreciation for the OI profile indicator. We've now extended its capabilities to include a new mode, OI + OI Change, that overlays both the absolute Open Interest and the OI Change (increase/decrease) for each strike, for both Calls and Puts, in a single consolidated bar chart.

That's all for today. Thank you.

— Archit Sunat

March 18th, 2026

Yesterday was weekly expiry. I ran a survey after market hours, asking you how Punch performed yesterday. Many of you responded. Thanks for your inputs.

Most of you said Punch is better than any broker you've used before. Execution was fast. Charting held up well. App was smooth.

What we've built is good, but not great yet.

We can do better.

Your average confidence in Punch is 7 out of 10.

That is not meeting the bar we have set for ourselves.

Your confidence needs to be 9+, and we will get there.

36% of your want execution to be even more fast. 33% of you experienced chart lag. Price slippage and charts crashing were the other areas you flagged.

Thanks for helping me and my team understand your current confidence level. That helps me set the target for the Punch team and myself.

I will keep running these surveys on volatile days and sharing results with you. Volatile days put the product under real stress. We need your feedback most on those days.

If you missed yesterday's survey, it's still open : Share your feedback with us.

For detailed feedback, email archit@punch.trade.

A quick product update (app version 2.0.0.82)

Watchlist grouping and sorting is live.

Toggle "Group by Type" to split your watchlist into Indices, Stocks, and Futures. Your custom order stays intact within each group. You can also sort by A-Z, Z-A, or % change (ascending/descending). Both features work independently of each other.

Trailing SL and protection for equity orders are currently in the testing phase. We plan to release them on both mobile and desktop together. We should have this out shortly.

Thank you,

- Amit Dhakad (CEO Punch & Market Pulse)