February 11th, 2026
Punch Build 2.0.0.68: Pivot Points on Option Charts, Custom Status Bar
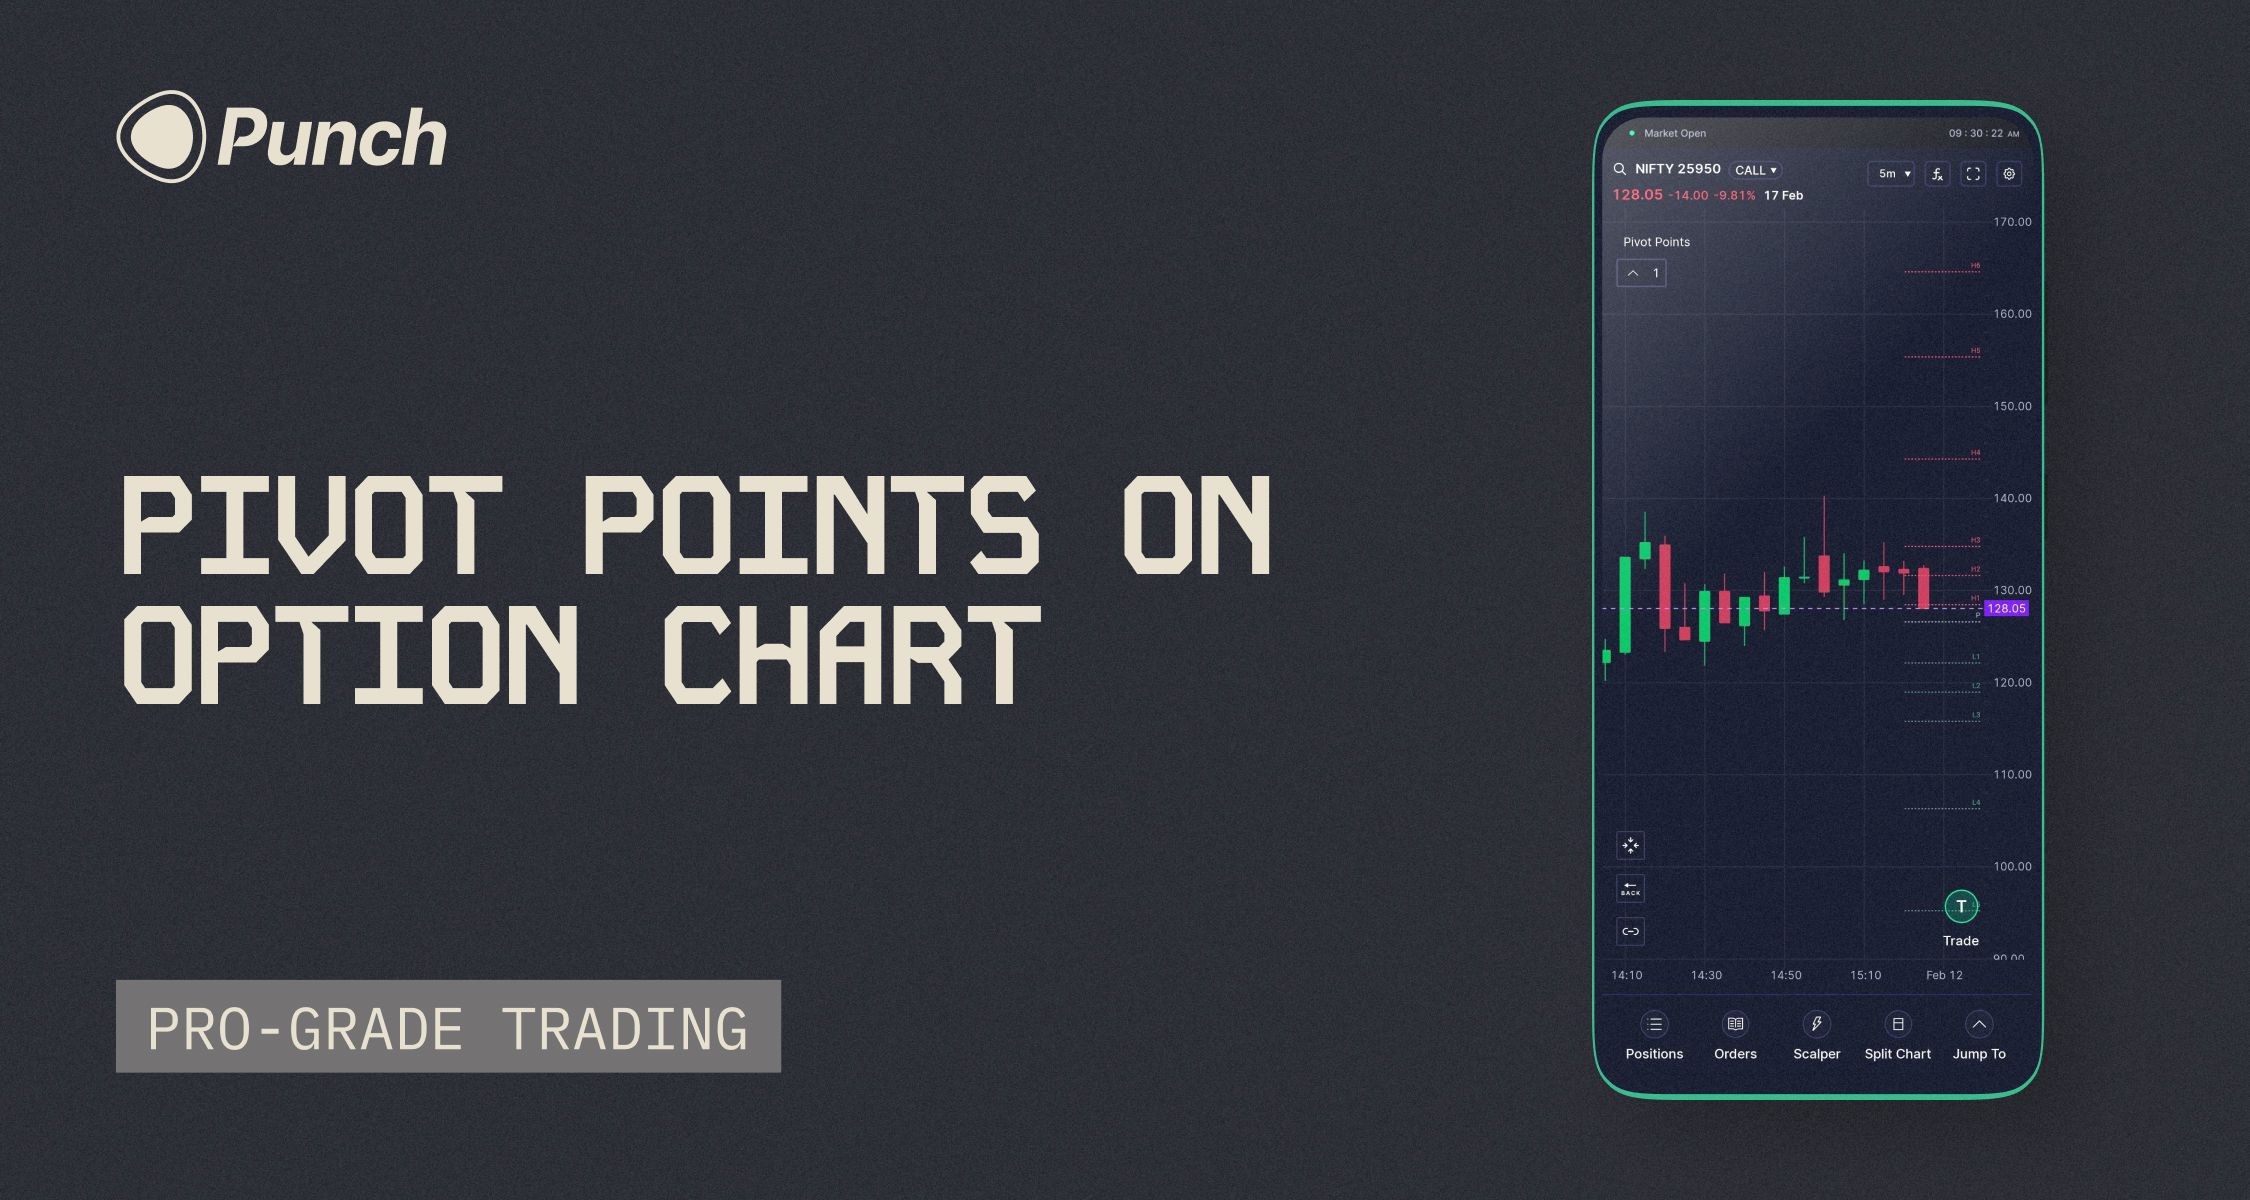
Pivot Points — Now on All Option Charts
This one has been a gap for a while.
Pivot points worked on index and equity charts. But if you opened an option strike chart — NIFTY CE, BANKNIFTY PE, any of them — no pivots.
A few weeks ago, I read this on the Builder's Lab:
"I observed Pivot Points are not plotted on option strikes in mobile as well desktop version. I am using Camarilla, Please check and update."
55 of you upvoted it. And hence I got the product team to prioritize and get it developed.
The reason this took time is that pivot point calculation depends on daily OHLC data. For indices and equities, that data is readily available. For individual option contracts, it wasn't — we had to first ensure daily OHLC was available for all options contracts before we could compute and plot pivots on them.
That's done now.
You can plot the following on any option chart:
Standard Pivots + CPR (Central Pivot Range) with key levels — Previous Day High and Previous Day Low
Fibonacci Pivots
Camarilla Pivots
All pivot methodologies are calculated from daily OHLC.
If you trade options using pivot-based strategies — whether it's Camarilla for intraday reversals or CPR for gauging range — this is an useful tool.
Custom Status Bar
Punch runs in full immersive mode on Android. This gives you the entire screen for charts and execution — no system UI eating into your space. But it also hides three things that matter during a trading session: the clock, your network status, and whether the market is open or closed.
I’ve heard about the clock one many times.
“Please add a realtime clock. This is a most important feature which is missing. In the current Punch app, we cannot see our mobile clock. TIME IS MONEY.”To test your preference, I had even run a small poll on the Builder’s Lab — Standard vs. Immersive mode. But interestingly, I got a mixed response, which led me to think that it’s not the system UI you need, but just the key information mentioned in the quote above.
So we’ve built a custom status bar that sits in the notch/cutout area of your screen — the space that was otherwise wasted.

It shows three things:
Market status — a colored indicator that tells you whether the market is open, closed, opening, or closing. During the last 5 minutes before open and before close, it shows a countdown timer so you know exactly how much time is left.
Clock — a real-time clock in HH:MM:SS format, updating every second. No more pulling down the notification shade mid-trade to check the time.
Network indicator — if your network drops or weakens, the market status is replaced with a "Weak Network" warning. This is important. When charts freeze or orders feel slow, you need to know whether it's the app or your connection.
The status bar is always on. No toggle needed. It appears on the dashboard screen and stays out of the way of your charts and touch targets.
On App Performance
Over the past couple of weeks, some of you reported app/price lags and chart loading delays. We've shipped several fixes for these already.
A couple more are on the way — specifically around issues with plotting horizontal lines via crosshair.
We'll keep at it.
That's all for this week.
— Archit Sunat